| - Acid Neutralizing Capacity (ANC; as CaCO3), UNF, TITR - |
| Lab: NWQL, PCode: 90410, MCode: TT040 |
| Analysis Dates: 10/03/01 through 09/26/16 |
| Open Data Set |
| Boxplot Description |
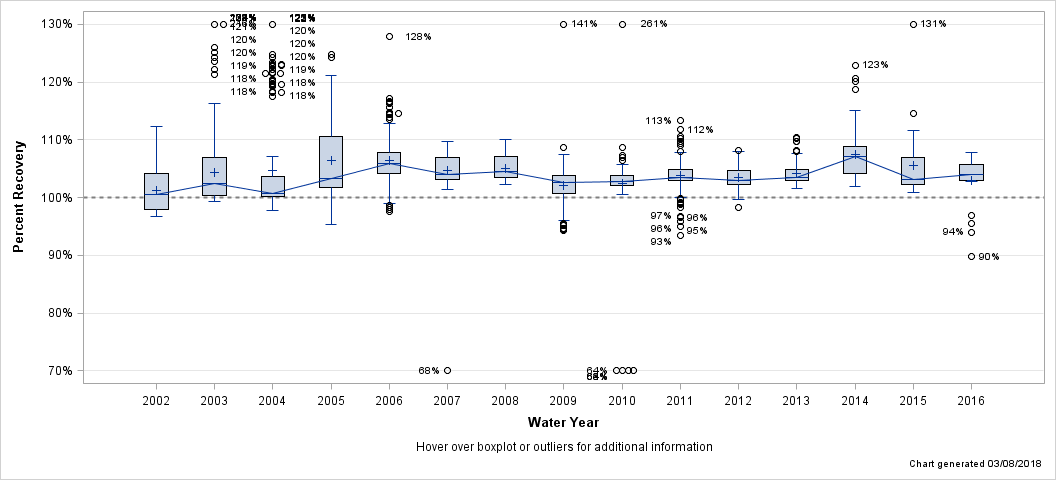
| - Acid Neutralizing Capacity (ANC; as CaCO3), UNF, TITR - |
| Lab: NWQL, PCode: 90410, MCode: TT040 |
| Analysis Dates: 10/03/01 through 09/26/16 |
| Open Data Set |
| Boxplot Description |

| Percent Recovery Statistics for Acid Neutralizing Capacity (ANC; as CaCO3), UNF, TITR |
| Analyte | Parm-meth Code | Water Year | # of Samples |
25th Pctl | 50th Pctl (Median) |
75th Pctl |
|---|---|---|---|---|---|---|
| Acid Neutralizing Capacity (ANC; as CaCO3), UNF, TITR | 90410TT040 | 2002 | 180 | 97.9% | 100.5% | 104.1% |
| 2003 | 179 | 100.4% | 102.4% | 107.0% | ||
| 2004 | 143 | 100.3% | 100.7% | 103.7% | ||
| 2005 | 144 | 101.8% | 103.4% | 110.6% | ||
| 2006 | 138 | 104.2% | 105.9% | 107.8% | ||
| 2007 | 134 | 103.1% | 104.1% | 106.9% | ||
| 2008 | 143 | 103.5% | 104.5% | 107.1% | ||
| 2009 | 141 | 100.7% | 102.7% | 103.8% | ||
| 2010 | 144 | 102.1% | 102.8% | 103.8% | ||
| 2011 | 137 | 102.9% | 103.6% | 104.9% | ||
| 2012 | 96 | 102.3% | 103.0% | 104.6% | ||
| 2013 | 76 | 103.0% | 103.6% | 104.9% | ||
| 2014 | 67 | 104.2% | 107.1% | 108.9% | ||
| 2015 | 24 | 102.2% | 103.1% | 106.9% | ||
| 2016 | 24 | 103.0% | 104.0% | 105.7% |
| Hover over boxplot or outliers for additional information |
| Chart generated 03/08/2018 |
| - Alkalinity (as CaCO3), FIL, TITR - |
| Lab: NWQL, PCode: 29801, MCode: TT040 |
| Analysis Dates: 10/03/01 through 09/30/16 |
| Open Data Set |
| Boxplot Description |
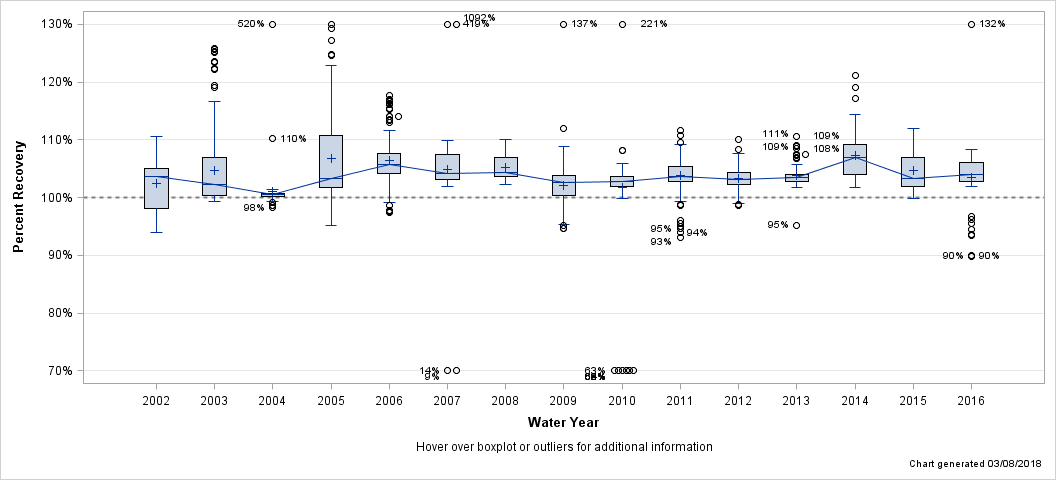
| Percent Recovery Statistics for Alkalinity (as CaCO3), FIL, TITR |
| Analyte | Parm-meth Code | Water Year | # of Samples |
25th Pctl | 50th Pctl (Median) |
75th Pctl |
|---|---|---|---|---|---|---|
| Alkalinity (as CaCO3), FIL, TITR | 29801TT040 | 2002 | 58 | 98.2% | 103.7% | 105.0% |
| 2003 | 163 | 100.3% | 102.2% | 106.9% | ||
| 2004 | 71 | 100.2% | 100.6% | 100.8% | ||
| 2005 | 144 | 101.7% | 103.3% | 110.7% | ||
| 2006 | 138 | 104.2% | 105.8% | 107.7% | ||
| 2007 | 134 | 103.1% | 104.1% | 107.5% | ||
| 2008 | 143 | 103.6% | 104.4% | 107.0% | ||
| 2009 | 137 | 100.4% | 102.6% | 103.8% | ||
| 2010 | 141 | 101.8% | 102.7% | 103.7% | ||
| 2011 | 136 | 102.8% | 103.7% | 105.4% | ||
| 2012 | 96 | 102.2% | 103.1% | 104.4% | ||
| 2013 | 76 | 102.8% | 103.5% | 104.1% | ||
| 2014 | 67 | 103.9% | 107.0% | 109.2% | ||
| 2015 | 48 | 102.0% | 103.3% | 107.0% | ||
| 2016 | 48 | 102.8% | 104.0% | 106.0% |
| Hover over boxplot or outliers for additional information |
| Chart generated 03/08/2018 |
| - Bromide, FIL, IC - |
| Lab: NWQL, PCode: 71870, MCode: IC027 |
| Analysis Dates: 10/21/10 through 09/20/16 |
| Open Data Set |
| Boxplot Description |
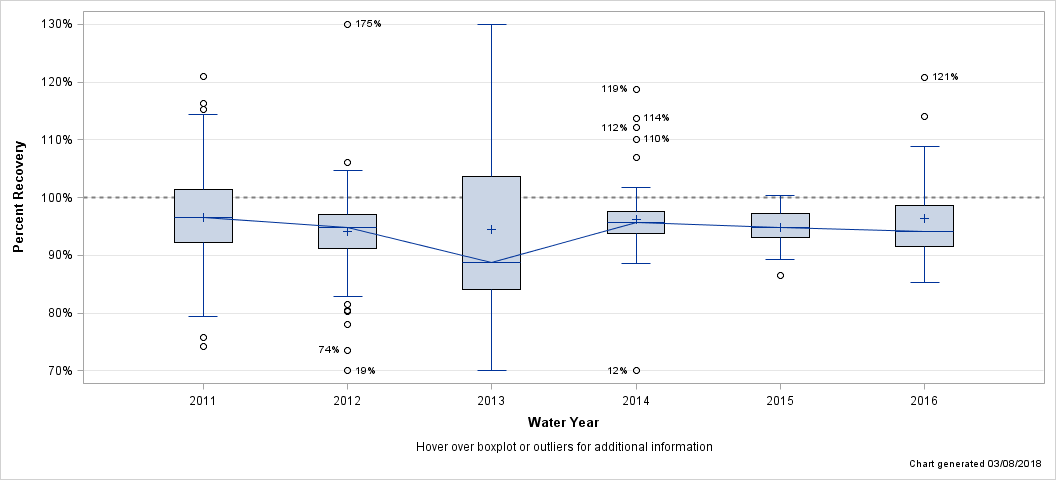
| Percent Recovery Statistics for Bromide, FIL, IC |
| Analyte | Parm-meth Code | Water Year | # of Samples |
25th Pctl | 50th Pctl (Median) |
75th Pctl |
|---|---|---|---|---|---|---|
| Bromide, FIL, IC | 71870IC027 | 2011 | 135 | 92.3% | 96.6% | 101.3% |
| 2012 | 96 | 91.2% | 94.8% | 97.1% | ||
| 2013 | 75 | 84.0% | 88.7% | 103.6% | ||
| 2014 | 67 | 93.9% | 95.7% | 97.6% | ||
| 2015 | 48 | 93.1% | 94.9% | 97.3% | ||
| 2016 | 41 | 91.5% | 94.1% | 98.6% |
| Hover over boxplot or outliers for additional information |
| Chart generated 03/08/2018 |
| - Calcium, FIL, ICP-OES - |
| Lab: NWQL, PCode: 00915, MCode: PLA11 |
| Analysis Dates: 10/03/01 through 09/21/16 |
| Open Data Set |
| Boxplot Description |
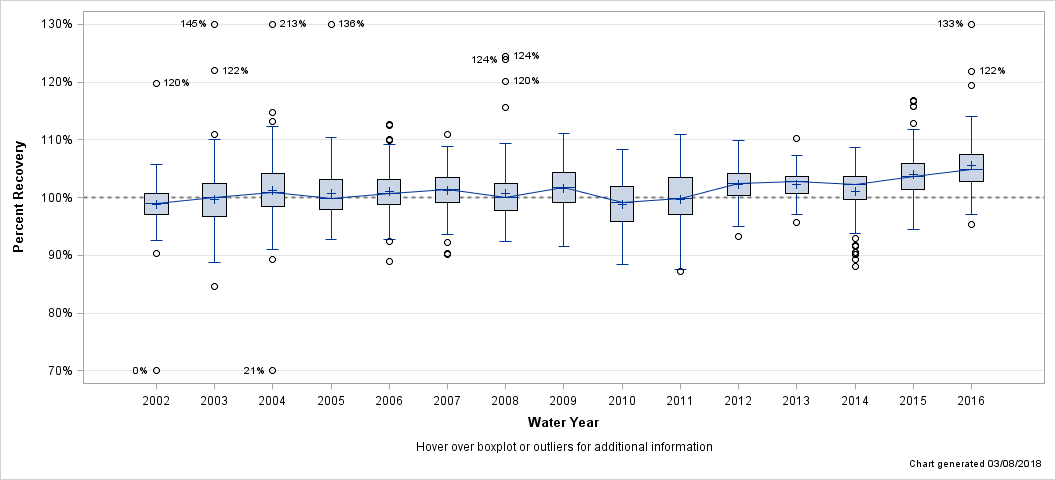
| Percent Recovery Statistics for Calcium, FIL, ICP-OES |
| Analyte | Parm-meth Code | Water Year | # of Samples |
25th Pctl | 50th Pctl (Median) |
75th Pctl |
|---|---|---|---|---|---|---|
| Calcium, FIL, ICP-OES | 00915PLA11 | 2002 | 240 | 97.0% | 99.0% | 100.8% |
| 2003 | 190 | 96.8% | 99.9% | 102.4% | ||
| 2004 | 192 | 98.5% | 100.9% | 104.1% | ||
| 2005 | 142 | 98.0% | 99.9% | 103.2% | ||
| 2006 | 142 | 98.9% | 100.7% | 103.1% | ||
| 2007 | 134 | 99.1% | 101.3% | 103.6% | ||
| 2008 | 137 | 97.8% | 100.1% | 102.5% | ||
| 2009 | 118 | 99.1% | 101.7% | 104.4% | ||
| 2010 | 144 | 95.8% | 99.1% | 101.9% | ||
| 2011 | 142 | 97.0% | 99.8% | 103.5% | ||
| 2012 | 134 | 100.3% | 102.5% | 104.2% | ||
| 2013 | 109 | 100.7% | 102.8% | 103.7% | ||
| 2014 | 107 | 99.6% | 102.2% | 103.7% | ||
| 2015 | 114 | 101.3% | 103.7% | 106.0% | ||
| 2016 | 83 | 102.7% | 104.9% | 107.4% |
| Hover over boxplot or outliers for additional information |
| Chart generated 03/08/2018 |
| - Calcium, UNF, ICP-OES - |
| Lab: NWQL, PCode: 00916, MCode: PLA15 |
| Analysis Dates: 12/08/06 through 03/24/15 |
| Open Data Set |
| Boxplot Description |
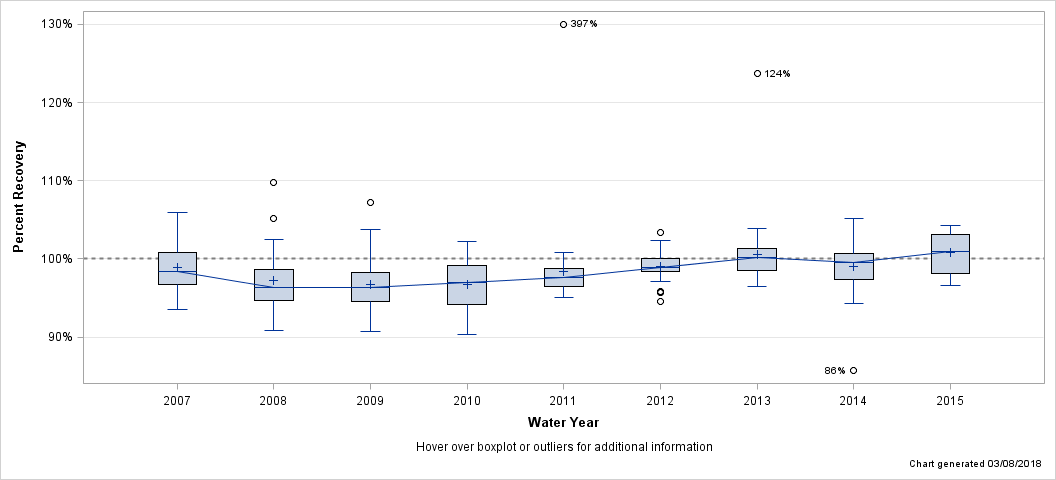
| Percent Recovery Statistics for Calcium, UNF, ICP-OES |
| Analyte | Parm-meth Code | Water Year | # of Samples |
25th Pctl | 50th Pctl (Median) |
75th Pctl |
|---|---|---|---|---|---|---|
| Calcium, UNF, ICP-OES | 00916PLA15 | 2007 | 42 | 96.7% | 98.4% | 100.9% |
| 2008 | 40 | 94.6% | 96.4% | 98.6% | ||
| 2009 | 34 | 94.6% | 96.3% | 98.3% | ||
| 2010 | 42 | 94.1% | 97.0% | 99.2% | ||
| 2011 | 41 | 96.5% | 97.6% | 98.8% | ||
| 2012 | 42 | 98.4% | 98.9% | 100.1% | ||
| 2013 | 42 | 98.5% | 100.1% | 101.3% | ||
| 2014 | 46 | 97.4% | 99.5% | 100.6% | ||
| 2015 | 16 | 98.2% | 101.0% | 103.1% |
| Hover over boxplot or outliers for additional information |
| Chart generated 03/08/2018 |
| - Chloride, FIL, IC - |
| Lab: NWQL, PCode: 00940, MCode: IC022 |
| Analysis Dates: 10/03/01 through 09/30/16 |
| Open Data Set |
| Boxplot Description |
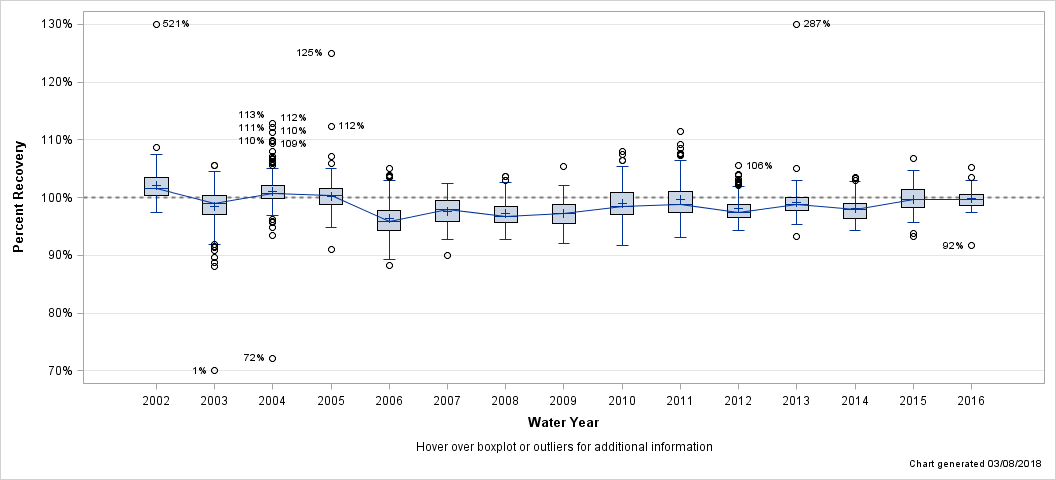
| Percent Recovery Statistics for Chloride, FIL, IC |
| Analyte | Parm-meth Code | Water Year | # of Samples |
25th Pctl | 50th Pctl (Median) |
75th Pctl |
|---|---|---|---|---|---|---|
| Chloride, FIL, IC | 00940IC022 | 2002 | 204 | 100.4% | 101.6% | 103.4% |
| 2003 | 239 | 97.0% | 99.0% | 100.4% | ||
| 2004 | 190 | 99.8% | 100.7% | 102.1% | ||
| 2005 | 144 | 98.8% | 100.4% | 101.6% | ||
| 2006 | 138 | 94.3% | 95.8% | 97.8% | ||
| 2007 | 134 | 95.8% | 97.9% | 99.5% | ||
| 2008 | 143 | 95.6% | 96.7% | 98.5% | ||
| 2009 | 140 | 95.6% | 97.3% | 98.8% | ||
| 2010 | 136 | 97.1% | 98.5% | 100.8% | ||
| 2011 | 138 | 97.4% | 98.9% | 101.0% | ||
| 2012 | 144 | 96.6% | 97.4% | 98.8% | ||
| 2013 | 124 | 97.8% | 98.8% | 100.0% | ||
| 2014 | 89 | 96.4% | 97.9% | 99.0% | ||
| 2015 | 72 | 98.3% | 99.7% | 101.3% | ||
| 2016 | 71 | 98.7% | 99.6% | 100.5% |
| Hover over boxplot or outliers for additional information |
| Chart generated 03/08/2018 |
| - Chloride, FIL, IC, LL - |
| Lab: NWQL, PCode: 00940, MCode: IC024 |
| Analysis Dates: 10/10/01 through 11/01/13 |
| Open Data Set |
| Boxplot Description |
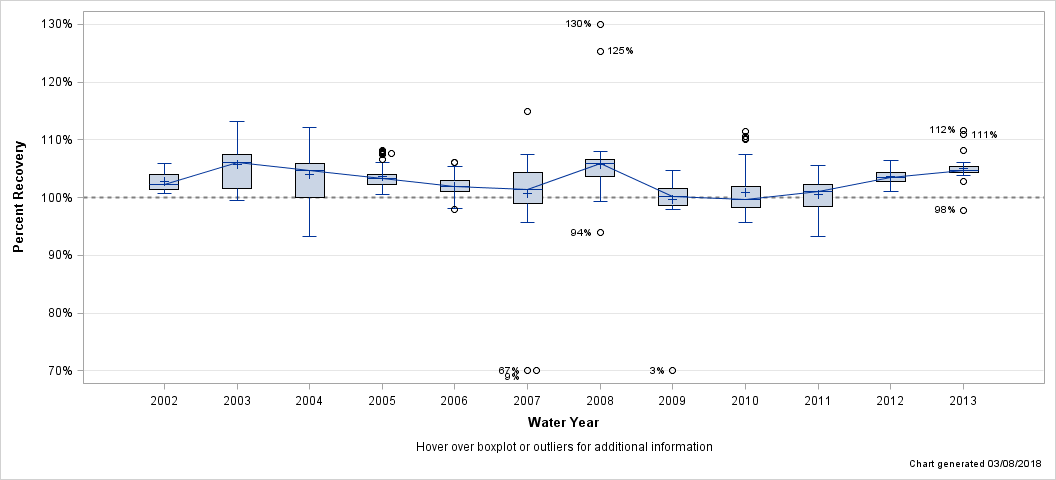
| Percent Recovery Statistics for Chloride, FIL, IC, LL |
| Analyte | Parm-meth Code | Water Year | # of Samples |
25th Pctl | 50th Pctl (Median) |
75th Pctl |
|---|---|---|---|---|---|---|
| Chloride, FIL, IC, LL | 00940IC024 | 2002 | 12 | 101.5% | 102.3% | 104.1% |
| 2003 | 22 | 101.6% | 106.0% | 107.5% | ||
| 2004 | 24 | 100.0% | 104.7% | 105.8% | ||
| 2005 | 48 | 102.3% | 103.2% | 104.0% | ||
| 2006 | 46 | 101.0% | 101.9% | 102.9% | ||
| 2007 | 46 | 98.9% | 101.3% | 104.4% | ||
| 2008 | 43 | 103.6% | 105.8% | 106.7% | ||
| 2009 | 40 | 98.7% | 100.2% | 101.6% | ||
| 2010 | 48 | 98.2% | 99.7% | 102.0% | ||
| 2011 | 47 | 98.4% | 101.0% | 102.3% | ||
| 2012 | 24 | 102.9% | 103.5% | 104.4% | ||
| 2013 | 24 | 104.4% | 104.7% | 105.3% |
| Hover over boxplot or outliers for additional information |
| Chart generated 03/08/2018 |
| - Fluoride, FIL - |
| Lab: NWQL, PCode: 00950, MCode: ISE04 |
| Analysis Dates: 05/01/02 through 05/28/03 |
| Open Data Set |
| Boxplot Description |
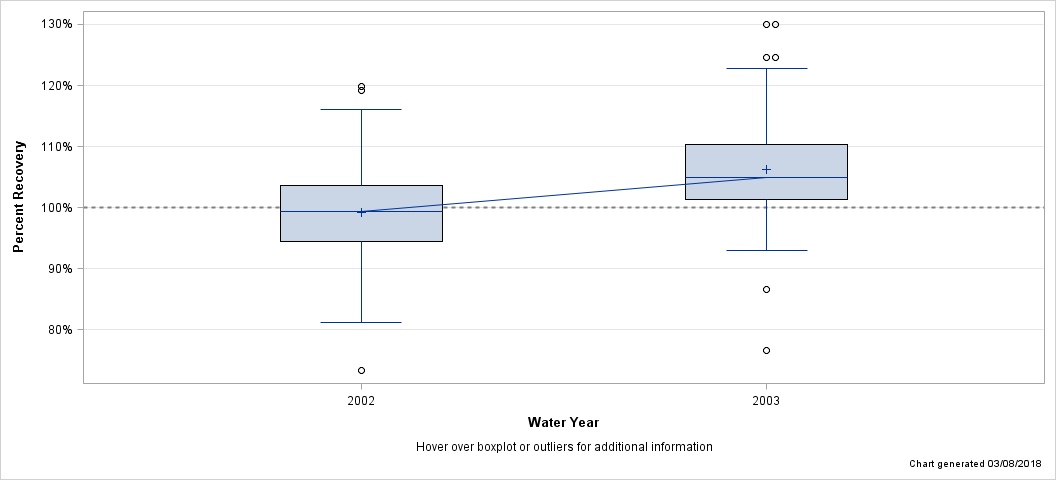
| Percent Recovery Statistics for Fluoride, FIL |
| Analyte | Parm-meth Code | Water Year | # of Samples |
25th Pctl | 50th Pctl (Median) |
75th Pctl |
|---|---|---|---|---|---|---|
| Fluoride, FIL | 00950ISE04 | 2002 | 99 | 94.5% | 99.4% | 103.7% |
| 2003 | 131 | 101.4% | 105.0% | 110.3% |
| Hover over boxplot or outliers for additional information |
| Chart generated 03/08/2018 |
| - Fluoride, FIL, IC - |
| Lab: NWQL, PCode: 00950, MCode: IC003 |
| Analysis Dates: 06/16/13 through 09/27/16 |
| Open Data Set |
| Boxplot Description |
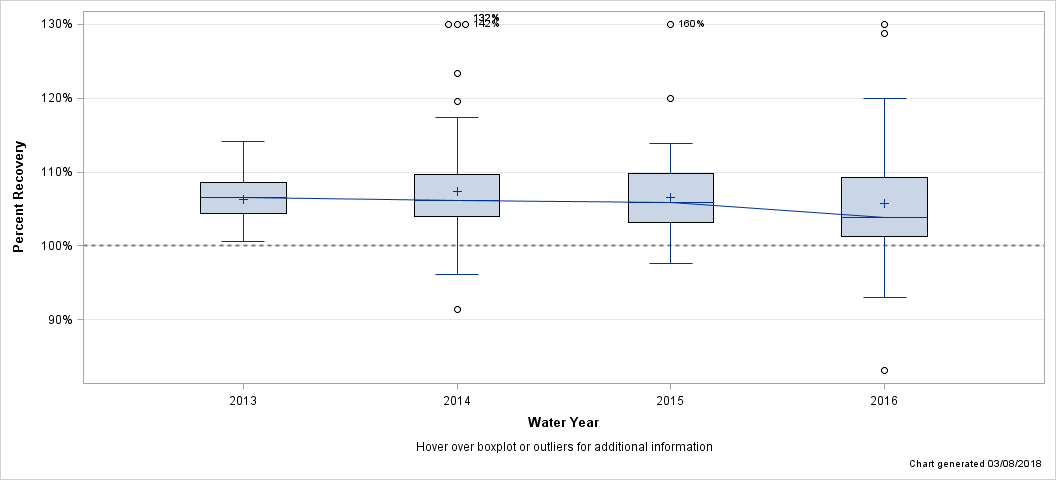
| Percent Recovery Statistics for Fluoride, FIL, IC |
| Analyte | Parm-meth Code | Water Year | # of Samples |
25th Pctl | 50th Pctl (Median) |
75th Pctl |
|---|---|---|---|---|---|---|
| Fluoride, FIL, IC | 00950IC003 | 2013 | 25 | 104.4% | 106.6% | 108.6% |
| 2014 | 89 | 104.0% | 106.1% | 109.7% | ||
| 2015 | 68 | 103.1% | 105.9% | 109.8% | ||
| 2016 | 57 | 101.3% | 103.9% | 109.3% |
| Hover over boxplot or outliers for additional information |
| Chart generated 03/08/2018 |
| - Fluoride, FIL, IC, LL - |
| Lab: NWQL, PCode: 00950, MCode: IC024 |
| Analysis Dates: 10/10/01 through 10/23/02 |
| Open Data Set |
| Boxplot Description |
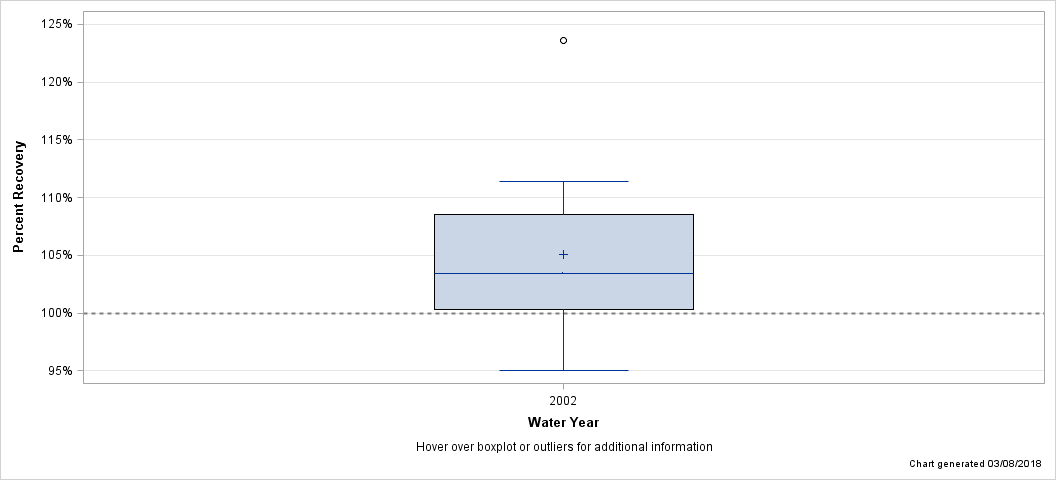
| Percent Recovery Statistics for Fluoride, FIL, IC, LL |
| Analyte | Parm-meth Code | Water Year | # of Samples |
25th Pctl | 50th Pctl (Median) |
75th Pctl |
|---|---|---|---|---|---|---|
| Fluoride, FIL, IC, LL | 00950IC024 | 2002 | 12 | 100.3% | 103.4% | 108.6% |
| Hover over boxplot or outliers for additional information |
| Chart generated 03/08/2018 |
| - Fluoride, FIL, ISE - |
| Lab: NWQL, PCode: 00950, MCode: ISE05 |
| Analysis Dates: 10/03/01 through 03/29/13 |
| Open Data Set |
| Boxplot Description |
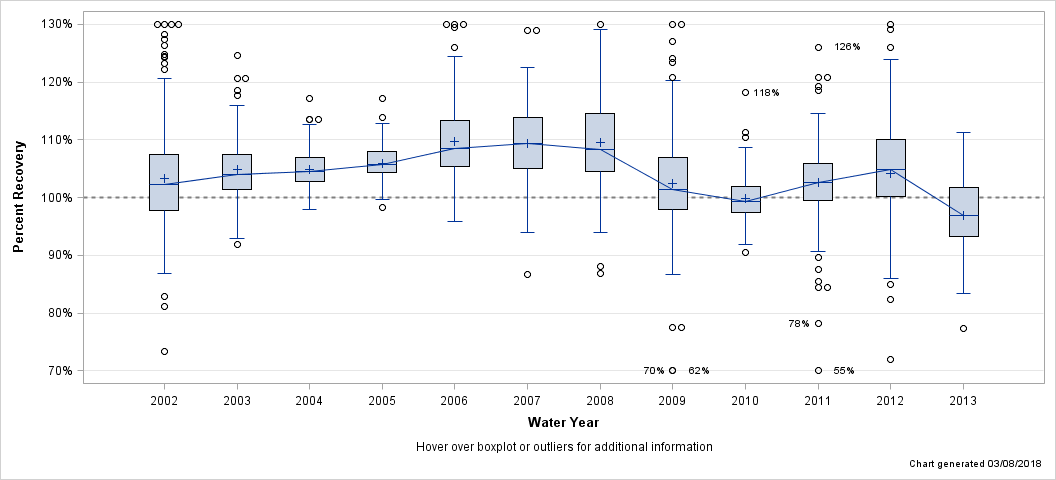
| Percent Recovery Statistics for Fluoride, FIL, ISE |
| Analyte | Parm-meth Code | Water Year | # of Samples |
25th Pctl | 50th Pctl (Median) |
75th Pctl |
|---|---|---|---|---|---|---|
| Fluoride, FIL, ISE | 00950ISE05 | 2002 | 238 | 97.8% | 102.3% | 107.5% |
| 2003 | 103 | 101.3% | 104.0% | 107.5% | ||
| 2004 | 160 | 102.7% | 104.5% | 106.9% | ||
| 2005 | 144 | 104.3% | 105.7% | 108.0% | ||
| 2006 | 138 | 105.3% | 108.5% | 113.3% | ||
| 2007 | 132 | 105.0% | 109.4% | 113.9% | ||
| 2008 | 143 | 104.6% | 108.4% | 114.6% | ||
| 2009 | 141 | 97.9% | 101.5% | 106.9% | ||
| 2010 | 144 | 97.4% | 99.3% | 101.9% | ||
| 2011 | 135 | 99.5% | 102.6% | 105.9% | ||
| 2012 | 96 | 100.2% | 104.9% | 110.1% | ||
| 2013 | 44 | 93.2% | 96.8% | 101.7% |
| Hover over boxplot or outliers for additional information |
| Chart generated 03/08/2018 |
| - Magnesium, FIL, ICP-OES - |
| Lab: NWQL, PCode: 00925, MCode: PLA11 |
| Analysis Dates: 10/03/01 through 09/21/16 |
| Open Data Set |
| Boxplot Description |
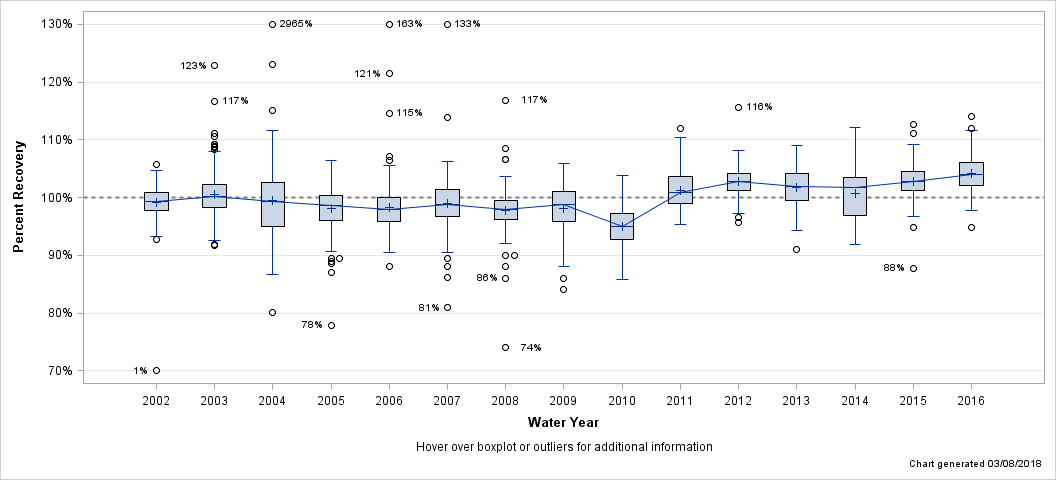
| Percent Recovery Statistics for Magnesium, FIL, ICP-OES |
| Analyte | Parm-meth Code | Water Year | # of Samples |
25th Pctl | 50th Pctl (Median) |
75th Pctl |
|---|---|---|---|---|---|---|
| Magnesium, FIL, ICP-OES | 00925PLA11 | 2002 | 240 | 97.7% | 99.3% | 100.9% |
| 2003 | 190 | 98.3% | 100.2% | 102.3% | ||
| 2004 | 192 | 95.0% | 99.4% | 102.7% | ||
| 2005 | 142 | 96.1% | 98.7% | 100.4% | ||
| 2006 | 142 | 95.8% | 97.9% | 100.0% | ||
| 2007 | 134 | 96.8% | 98.7% | 101.4% | ||
| 2008 | 137 | 96.2% | 97.9% | 99.5% | ||
| 2009 | 118 | 95.8% | 98.8% | 101.1% | ||
| 2010 | 144 | 92.7% | 95.0% | 97.3% | ||
| 2011 | 142 | 98.9% | 100.9% | 103.7% | ||
| 2012 | 134 | 101.2% | 102.9% | 104.2% | ||
| 2013 | 109 | 99.4% | 102.0% | 104.2% | ||
| 2014 | 107 | 96.8% | 101.8% | 103.4% | ||
| 2015 | 114 | 101.2% | 102.8% | 104.6% | ||
| 2016 | 83 | 102.1% | 104.0% | 106.1% |
| Hover over boxplot or outliers for additional information |
| Chart generated 03/08/2018 |
| - Magnesium, UNF, ICP-OES - |
| Lab: NWQL, PCode: 00927, MCode: PLA15 |
| Analysis Dates: 12/08/06 through 03/24/15 |
| Open Data Set |
| Boxplot Description |
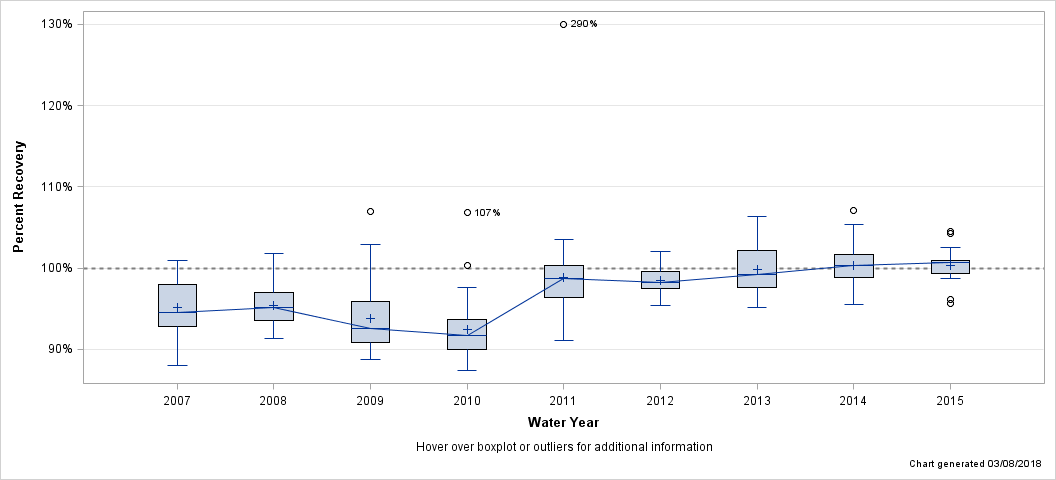
| Percent Recovery Statistics for Magnesium, UNF, ICP-OES |
| Analyte | Parm-meth Code | Water Year | # of Samples |
25th Pctl | 50th Pctl (Median) |
75th Pctl |
|---|---|---|---|---|---|---|
| Magnesium, UNF, ICP-OES | 00927PLA15 | 2007 | 42 | 92.8% | 94.5% | 97.9% |
| 2008 | 40 | 93.6% | 95.1% | 96.9% | ||
| 2009 | 34 | 90.8% | 92.6% | 95.9% | ||
| 2010 | 42 | 90.0% | 91.7% | 93.6% | ||
| 2011 | 41 | 96.4% | 98.7% | 100.3% | ||
| 2012 | 42 | 97.5% | 98.2% | 99.6% | ||
| 2013 | 42 | 97.7% | 99.3% | 102.2% | ||
| 2014 | 46 | 98.9% | 100.3% | 101.6% | ||
| 2015 | 16 | 99.4% | 100.7% | 100.9% |
| Hover over boxplot or outliers for additional information |
| Chart generated 03/08/2018 |
| - Potassium, FIL - |
| Lab: NWQL, PCode: 00935, MCode: |
| Analysis Dates: 05/23/03 through 06/28/03 |
| Open Data Set |
| Boxplot Description |
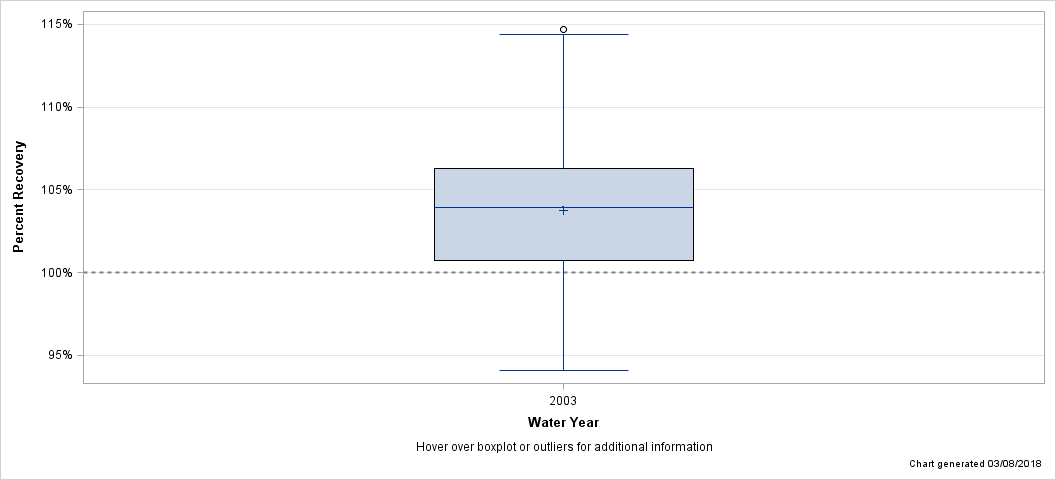
| Percent Recovery Statistics for Potassium, FIL |
| Analyte | Parm-meth Code | Water Year | # of Samples |
25th Pctl | 50th Pctl (Median) |
75th Pctl |
|---|---|---|---|---|---|---|
| Potassium, FIL | 00935 | 2003 | 38 | 100.7% | 103.9% | 106.3% |
| Hover over boxplot or outliers for additional information |
| Chart generated 03/08/2018 |
| - Potassium, FIL, AA - |
| Lab: NWQL, PCode: 00935, MCode: AA030 |
| Analysis Dates: 10/03/01 through 05/14/03 |
| Open Data Set |
| Boxplot Description |
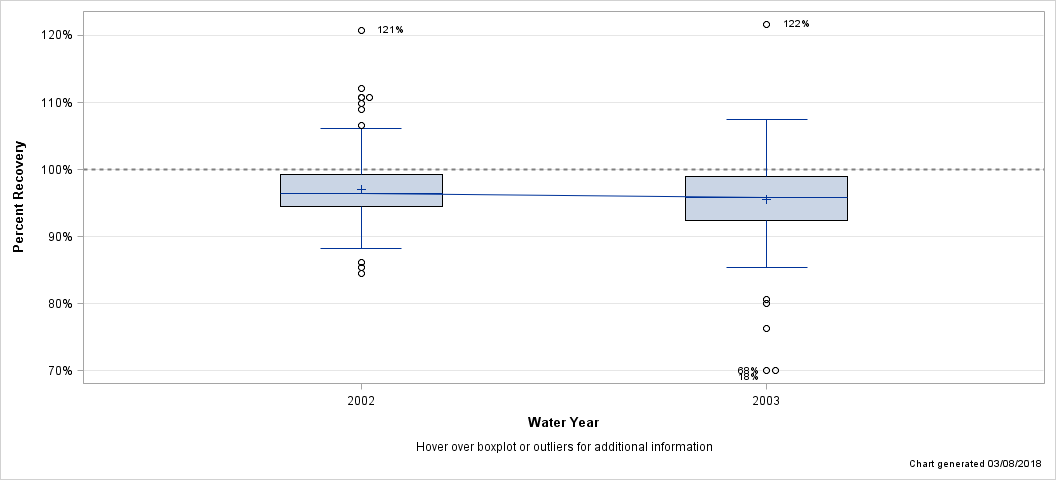
| Percent Recovery Statistics for Potassium, FIL, AA |
| Analyte | Parm-meth Code | Water Year | # of Samples |
25th Pctl | 50th Pctl (Median) |
75th Pctl |
|---|---|---|---|---|---|---|
| Potassium, FIL, AA | 00935AA030 | 2002 | 240 | 94.4% | 96.4% | 99.2% |
| 2003 | 131 | 92.4% | 95.9% | 98.9% |
| Hover over boxplot or outliers for additional information |
| Chart generated 03/08/2018 |
| - Potassium, FIL, AA, LL - |
| Lab: NWQL, PCode: 00935, MCode: AA031 |
| Analysis Dates: 10/31/02 through 05/13/03 |
| Open Data Set |
| Boxplot Description |
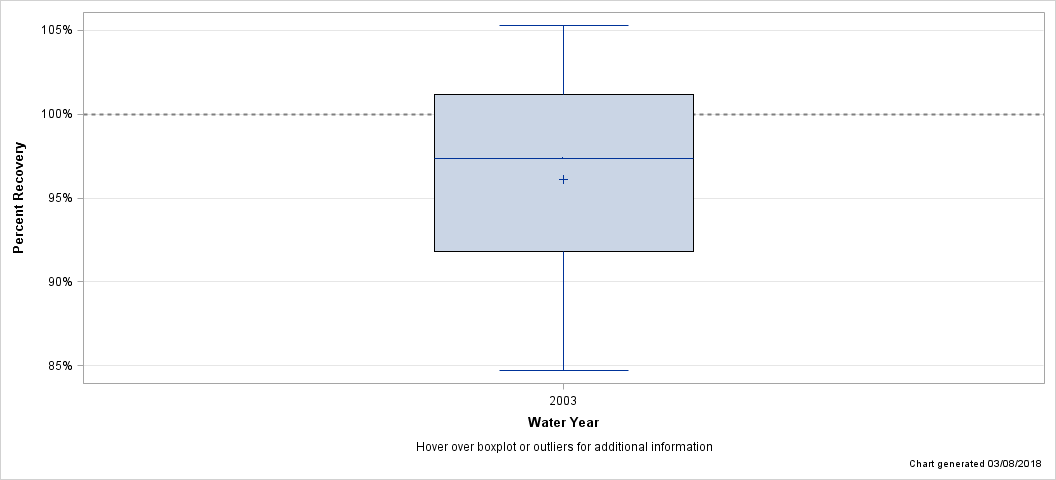
| Percent Recovery Statistics for Potassium, FIL, AA, LL |
| Analyte | Parm-meth Code | Water Year | # of Samples |
25th Pctl | 50th Pctl (Median) |
75th Pctl |
|---|---|---|---|---|---|---|
| Potassium, FIL, AA, LL | 00935AA031 | 2003 | 14 | 91.8% | 97.4% | 101.2% |
| Hover over boxplot or outliers for additional information |
| Chart generated 03/08/2018 |
| - Potassium, FIL, ICP-OES - |
| Lab: NWQL, PCode: 00935, MCode: PLO03 |
| Analysis Dates: 06/05/03 through 09/29/16 |
| Open Data Set |
| Boxplot Description |
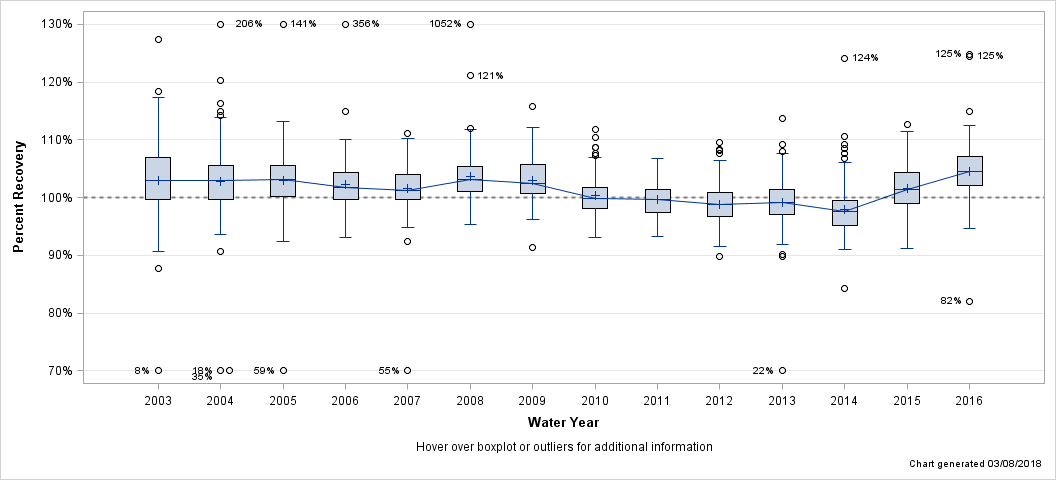
| Percent Recovery Statistics for Potassium, FIL, ICP-OES |
| Analyte | Parm-meth Code | Water Year | # of Samples |
25th Pctl | 50th Pctl (Median) |
75th Pctl |
|---|---|---|---|---|---|---|
| Potassium, FIL, ICP-OES | 00935PLO03 | 2003 | 85 | 99.6% | 103.0% | 107.0% |
| 2004 | 168 | 99.7% | 102.9% | 105.5% | ||
| 2005 | 143 | 100.2% | 103.1% | 105.6% | ||
| 2006 | 144 | 99.7% | 101.7% | 104.3% | ||
| 2007 | 135 | 99.7% | 101.3% | 104.0% | ||
| 2008 | 141 | 101.1% | 103.1% | 105.4% | ||
| 2009 | 110 | 100.7% | 102.5% | 105.7% | ||
| 2010 | 144 | 98.2% | 99.8% | 101.8% | ||
| 2011 | 143 | 97.3% | 99.7% | 101.5% | ||
| 2012 | 141 | 96.7% | 98.7% | 100.9% | ||
| 2013 | 121 | 97.1% | 99.1% | 101.3% | ||
| 2014 | 107 | 95.1% | 97.6% | 99.6% | ||
| 2015 | 114 | 98.9% | 101.4% | 104.4% | ||
| 2016 | 81 | 102.1% | 104.4% | 107.0% |
| Hover over boxplot or outliers for additional information |
| Chart generated 03/08/2018 |
| - Potassium, FIL, ICP-OES, LL - |
| Lab: NWQL, PCode: 00935, MCode: PLO02 |
| Analysis Dates: 06/18/03 through 09/13/16 |
| Open Data Set |
| Boxplot Description |
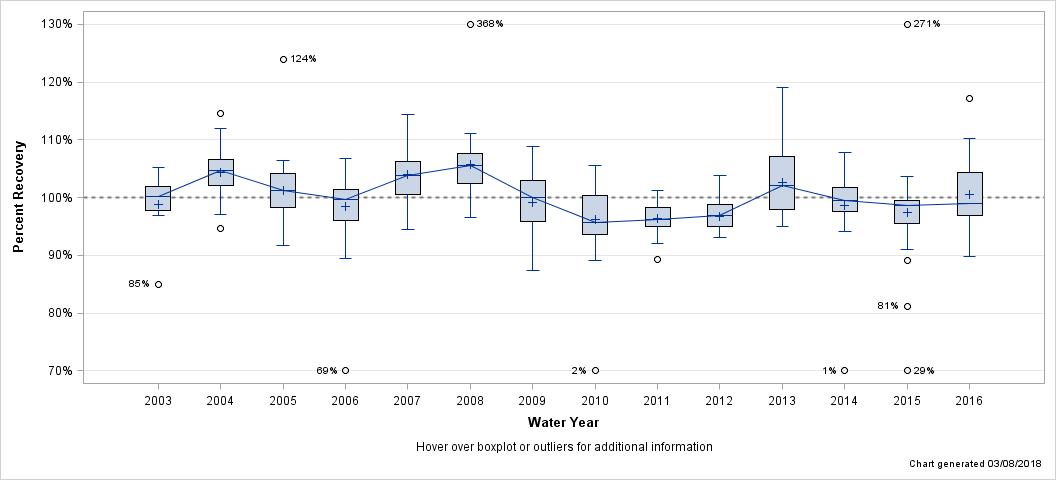
| Percent Recovery Statistics for Potassium, FIL, ICP-OES, LL |
| Analyte | Parm-meth Code | Water Year | # of Samples |
25th Pctl | 50th Pctl (Median) |
75th Pctl |
|---|---|---|---|---|---|---|
| Potassium, FIL, ICP-OES, LL | 00935PLO02 | 2003 | 8 | 97.8% | 100.1% | 102.0% |
| 2004 | 24 | 102.1% | 104.7% | 106.6% | ||
| 2005 | 46 | 98.2% | 101.3% | 104.1% | ||
| 2006 | 46 | 96.1% | 99.7% | 101.4% | ||
| 2007 | 46 | 100.6% | 103.8% | 106.3% | ||
| 2008 | 43 | 102.5% | 105.5% | 107.7% | ||
| 2009 | 40 | 95.8% | 100.0% | 102.9% | ||
| 2010 | 48 | 93.6% | 95.7% | 100.3% | ||
| 2011 | 47 | 94.9% | 96.2% | 98.3% | ||
| 2012 | 23 | 94.9% | 96.9% | 98.7% | ||
| 2013 | 24 | 97.9% | 102.2% | 107.0% | ||
| 2014 | 22 | 97.6% | 99.4% | 101.8% | ||
| 2015 | 24 | 95.5% | 98.7% | 99.5% | ||
| 2016 | 23 | 96.9% | 99.0% | 104.3% |
| Hover over boxplot or outliers for additional information |
| Chart generated 03/08/2018 |
| - Potassium, UNF, ICP-OES - |
| Lab: NWQL, PCode: 00937, MCode: PLO01 |
| Analysis Dates: 11/12/09 through 02/10/14 |
| Open Data Set |
| Boxplot Description |
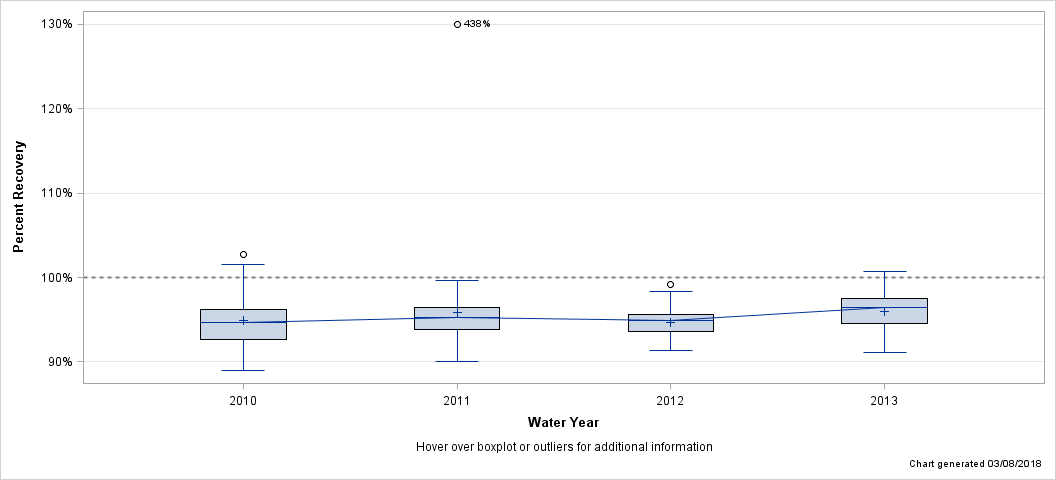
| Percent Recovery Statistics for Potassium, UNF, ICP-OES |
| Analyte | Parm-meth Code | Water Year | # of Samples |
25th Pctl | 50th Pctl (Median) |
75th Pctl |
|---|---|---|---|---|---|---|
| Potassium, UNF, ICP-OES | 00937PLO01 | 2010 | 42 | 92.6% | 94.7% | 96.2% |
| 2011 | 41 | 93.9% | 95.3% | 96.5% | ||
| 2012 | 42 | 93.6% | 94.9% | 95.6% | ||
| 2013 | 42 | 94.6% | 96.4% | 97.5% |
| Hover over boxplot or outliers for additional information |
| Chart generated 03/08/2018 |
| - Silica, FIL, CFA - |
| Lab: NWQL, PCode: 00955, MCode: CL064 |
| Analysis Dates: 10/03/01 through 02/17/10 |
| Open Data Set |
| Boxplot Description |
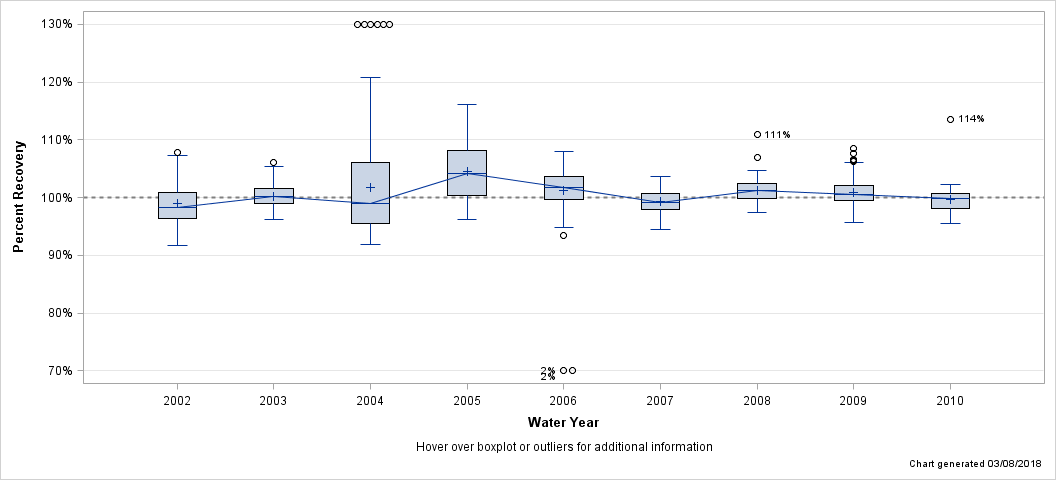
| Percent Recovery Statistics for Silica, FIL, CFA |
| Analyte | Parm-meth Code | Water Year | # of Samples |
25th Pctl | 50th Pctl (Median) |
75th Pctl |
|---|---|---|---|---|---|---|
| Silica, FIL, CFA | 00955CL064 | 2002 | 130 | 96.4% | 98.3% | 100.9% |
| 2003 | 88 | 98.9% | 100.2% | 101.5% | ||
| 2004 | 120 | 95.5% | 98.9% | 106.0% | ||
| 2005 | 144 | 100.4% | 104.2% | 108.2% | ||
| 2006 | 138 | 99.7% | 101.8% | 103.6% | ||
| 2007 | 133 | 98.0% | 99.2% | 100.8% | ||
| 2008 | 143 | 99.8% | 101.2% | 102.4% | ||
| 2009 | 130 | 99.5% | 100.5% | 102.2% | ||
| 2010 | 43 | 98.2% | 99.8% | 100.7% |
| Hover over boxplot or outliers for additional information |
| Chart generated 03/08/2018 |
| - Silica, FIL, DA - |
| Lab: NWQL, PCode: 00955, MCode: CL151 |
| Analysis Dates: 03/15/10 through 09/29/16 |
| Open Data Set |
| Boxplot Description |
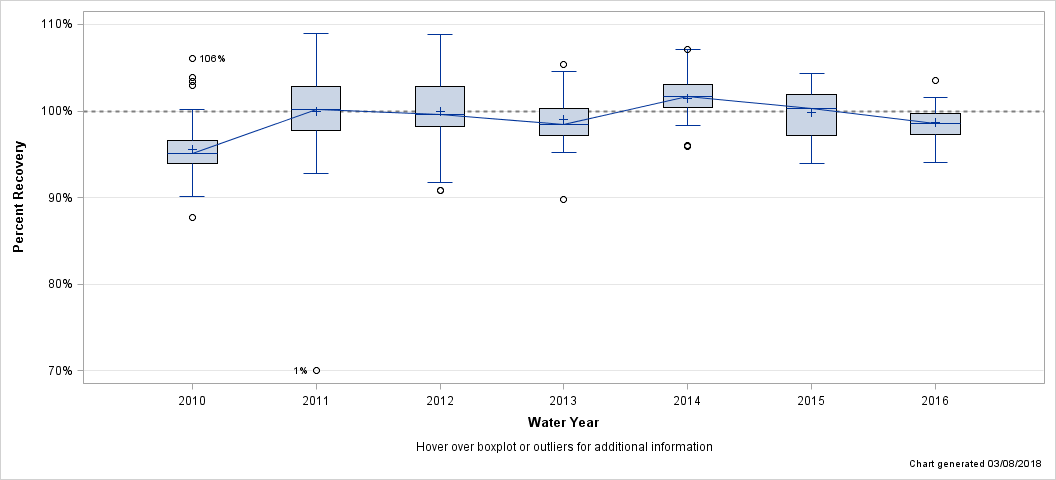
| Percent Recovery Statistics for Silica, FIL, DA |
| Analyte | Parm-meth Code | Water Year | # of Samples |
25th Pctl | 50th Pctl (Median) |
75th Pctl |
|---|---|---|---|---|---|---|
| Silica, FIL, DA | 00955CL151 | 2010 | 62 | 94.0% | 95.1% | 96.7% |
| 2011 | 134 | 97.8% | 100.2% | 102.8% | ||
| 2012 | 94 | 98.2% | 99.6% | 102.8% | ||
| 2013 | 48 | 97.2% | 98.5% | 100.3% | ||
| 2014 | 33 | 100.4% | 101.7% | 103.1% | ||
| 2015 | 24 | 97.1% | 100.3% | 101.9% | ||
| 2016 | 20 | 97.3% | 98.6% | 99.8% |
| Hover over boxplot or outliers for additional information |
| Chart generated 03/08/2018 |
| - Silica, FIL, ICP-OES - |
| Lab: NWQL, PCode: 00955, MCode: PLA11 |
| Analysis Dates: 10/03/01 through 09/29/16 |
| Open Data Set |
| Boxplot Description |
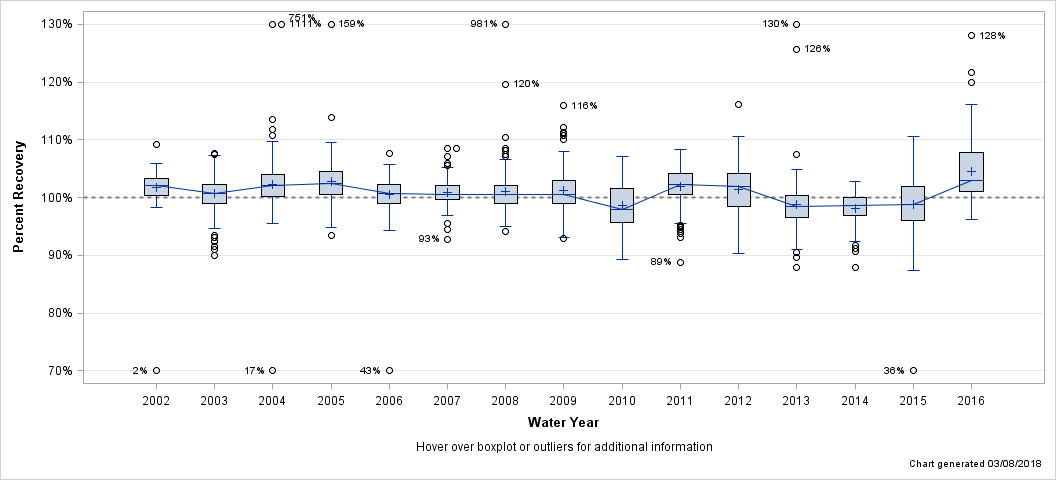
| Percent Recovery Statistics for Silica, FIL, ICP-OES |
| Analyte | Parm-meth Code | Water Year | # of Samples |
25th Pctl | 50th Pctl (Median) |
75th Pctl |
|---|---|---|---|---|---|---|
| Silica, FIL, ICP-OES | 00955PLA11 | 2002 | 108 | 100.3% | 102.1% | 103.3% |
| 2003 | 180 | 98.9% | 100.8% | 102.3% | ||
| 2004 | 168 | 100.2% | 102.1% | 104.0% | ||
| 2005 | 141 | 100.6% | 102.4% | 104.6% | ||
| 2006 | 144 | 99.0% | 100.7% | 102.2% | ||
| 2007 | 135 | 99.7% | 100.6% | 102.0% | ||
| 2008 | 141 | 99.0% | 100.5% | 102.1% | ||
| 2009 | 110 | 99.0% | 100.5% | 102.9% | ||
| 2010 | 144 | 95.6% | 97.9% | 101.6% | ||
| 2011 | 143 | 100.6% | 102.3% | 104.1% | ||
| 2012 | 140 | 98.4% | 101.9% | 104.1% | ||
| 2013 | 121 | 96.6% | 98.5% | 100.4% | ||
| 2014 | 107 | 96.9% | 98.6% | 100.1% | ||
| 2015 | 114 | 96.1% | 98.8% | 102.0% | ||
| 2016 | 81 | 101.0% | 103.0% | 107.7% |
| Hover over boxplot or outliers for additional information |
| Chart generated 03/08/2018 |
| - Silica, UNF, ICP-OES - |
| Lab: NWQL, PCode: 00956, MCode: PLA15 |
| Analysis Dates: 02/29/12 through 03/24/15 |
| Open Data Set |
| Boxplot Description |
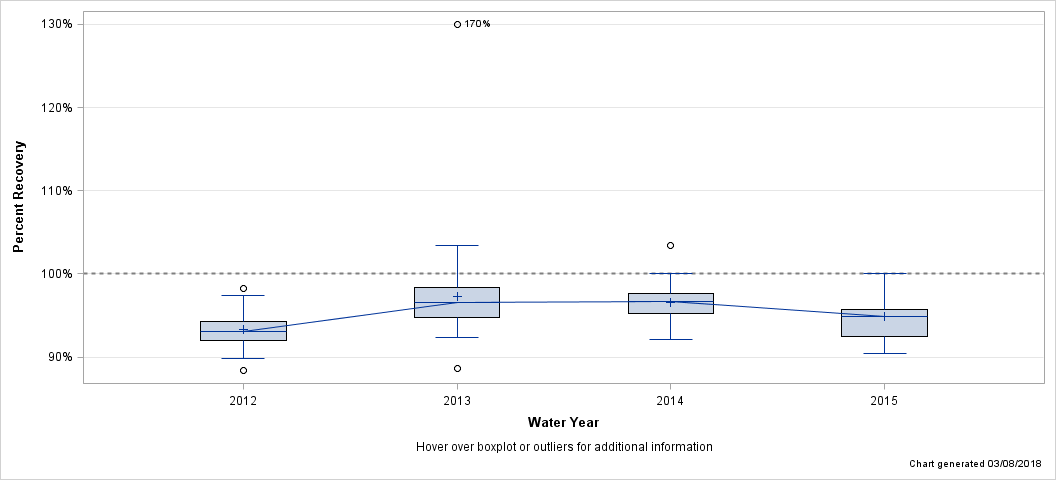
| Percent Recovery Statistics for Silica, UNF, ICP-OES |
| Analyte | Parm-meth Code | Water Year | # of Samples |
25th Pctl | 50th Pctl (Median) |
75th Pctl |
|---|---|---|---|---|---|---|
| Silica, UNF, ICP-OES | 00956PLA15 | 2012 | 14 | 92.0% | 93.1% | 94.3% |
| 2013 | 42 | 94.7% | 96.6% | 98.4% | ||
| 2014 | 46 | 95.3% | 96.6% | 97.6% | ||
| 2015 | 16 | 92.5% | 94.9% | 95.7% |
| Hover over boxplot or outliers for additional information |
| Chart generated 03/08/2018 |
| - Sodium, FIL, ICP-OES - |
| Lab: NWQL, PCode: 00930, MCode: PLA11 |
| Analysis Dates: 10/03/01 through 09/29/16 |
| Open Data Set |
| Boxplot Description |
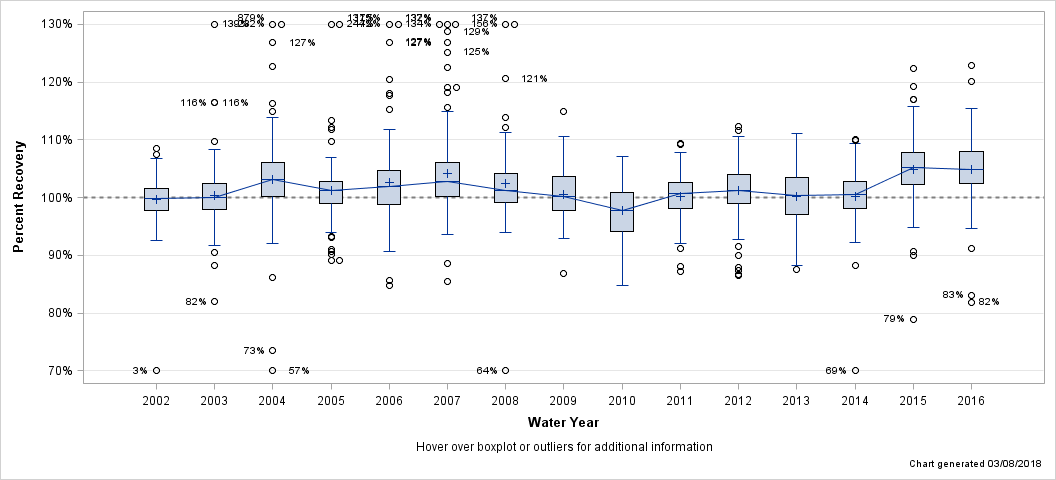
| Percent Recovery Statistics for Sodium, FIL, ICP-OES |
| Analyte | Parm-meth Code | Water Year | # of Samples |
25th Pctl | 50th Pctl (Median) |
75th Pctl |
|---|---|---|---|---|---|---|
| Sodium, FIL, ICP-OES | 00930PLA11 | 2002 | 240 | 97.8% | 99.9% | 101.5% |
| 2003 | 190 | 98.0% | 100.1% | 102.4% | ||
| 2004 | 192 | 100.2% | 103.2% | 106.0% | ||
| 2005 | 142 | 99.0% | 101.3% | 102.8% | ||
| 2006 | 142 | 98.8% | 101.8% | 104.7% | ||
| 2007 | 134 | 100.1% | 102.8% | 106.1% | ||
| 2008 | 137 | 99.2% | 101.2% | 104.2% | ||
| 2009 | 118 | 97.8% | 100.2% | 103.7% | ||
| 2010 | 144 | 94.2% | 97.8% | 100.8% | ||
| 2011 | 142 | 98.2% | 100.8% | 102.6% | ||
| 2012 | 134 | 99.1% | 101.3% | 103.9% | ||
| 2013 | 109 | 97.2% | 100.3% | 103.5% | ||
| 2014 | 107 | 98.1% | 100.5% | 102.8% | ||
| 2015 | 114 | 102.3% | 105.2% | 107.8% | ||
| 2016 | 82 | 102.5% | 104.9% | 107.9% |
| Hover over boxplot or outliers for additional information |
| Chart generated 03/08/2018 |
| - Sodium, UNF, ICP-OES - |
| Lab: NWQL, PCode: 00929, MCode: PLA15 |
| Analysis Dates: 10/30/07 through 03/24/15 |
| Open Data Set |
| Boxplot Description |
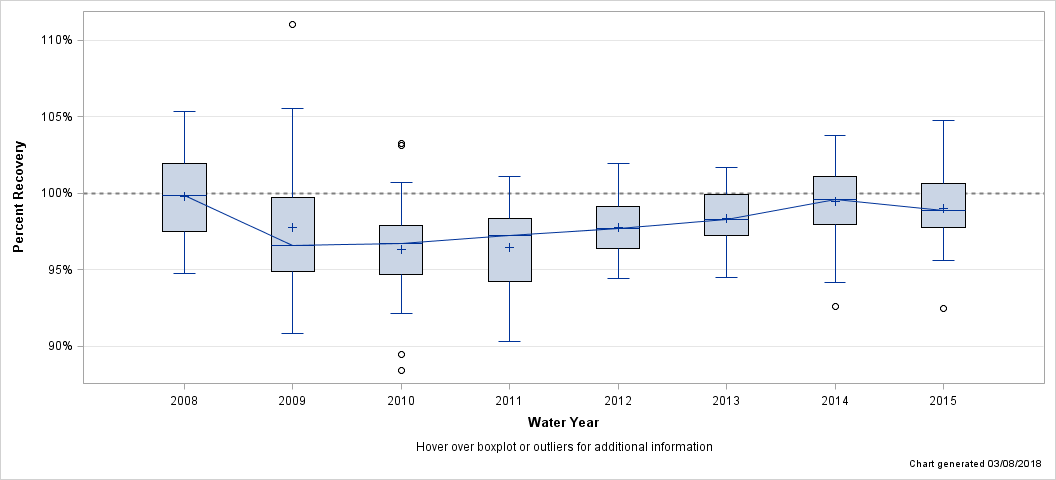
| Percent Recovery Statistics for Sodium, UNF, ICP-OES |
| Analyte | Parm-meth Code | Water Year | # of Samples |
25th Pctl | 50th Pctl (Median) |
75th Pctl |
|---|---|---|---|---|---|---|
| Sodium, UNF, ICP-OES | 00929PLA15 | 2008 | 40 | 97.5% | 99.8% | 102.0% |
| 2009 | 34 | 94.9% | 96.6% | 99.7% | ||
| 2010 | 42 | 94.7% | 96.7% | 97.9% | ||
| 2011 | 41 | 94.3% | 97.2% | 98.3% | ||
| 2012 | 42 | 96.4% | 97.7% | 99.2% | ||
| 2013 | 42 | 97.3% | 98.3% | 99.9% | ||
| 2014 | 46 | 97.9% | 99.6% | 101.1% | ||
| 2015 | 16 | 97.8% | 98.9% | 100.6% |
| Hover over boxplot or outliers for additional information |
| Chart generated 03/08/2018 |
| - Solids @105 Deg C, UNF, GRAV - |
| Lab: NWQL, PCode: 00500, MCode: ROE12 |
| Analysis Dates: 10/20/03 through 09/27/16 |
| Open Data Set |
| Boxplot Description |
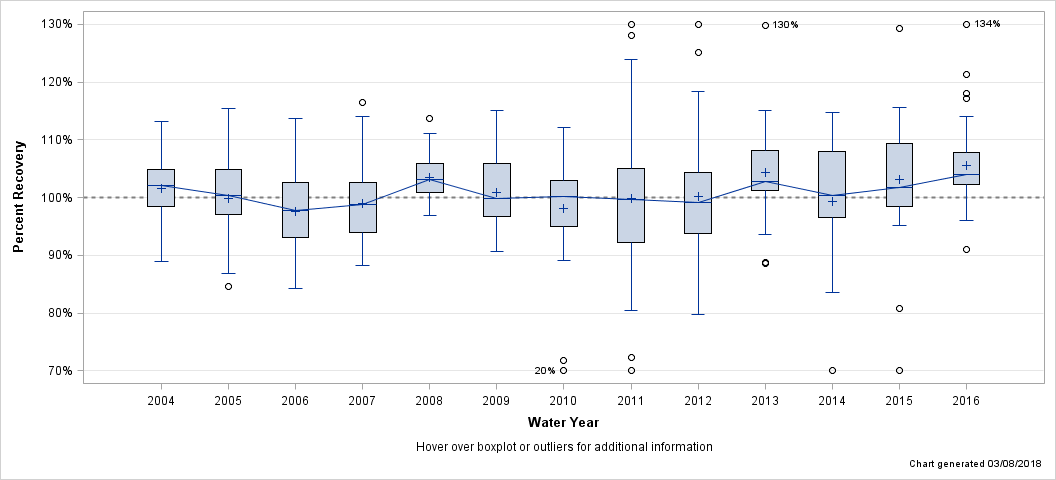
| Percent Recovery Statistics for Solids @105 Deg C, UNF, GRAV |
| Analyte | Parm-meth Code | Water Year | # of Samples |
25th Pctl | 50th Pctl (Median) |
75th Pctl |
|---|---|---|---|---|---|---|
| Solids @105 Deg C, UNF, GRAV | 00500ROE12 | 2004 | 48 | 98.5% | 102.2% | 104.9% |
| 2005 | 35 | 97.1% | 100.4% | 104.8% | ||
| 2006 | 24 | 93.0% | 97.7% | 102.7% | ||
| 2007 | 34 | 94.0% | 98.8% | 102.6% | ||
| 2008 | 36 | 100.9% | 103.1% | 105.9% | ||
| 2009 | 33 | 96.8% | 99.8% | 105.9% | ||
| 2010 | 36 | 95.1% | 100.1% | 102.9% | ||
| 2011 | 35 | 92.2% | 99.7% | 105.1% | ||
| 2012 | 32 | 93.7% | 99.2% | 104.4% | ||
| 2013 | 36 | 101.3% | 102.7% | 108.2% | ||
| 2014 | 12 | 96.5% | 100.3% | 108.0% | ||
| 2015 | 36 | 98.4% | 101.7% | 109.4% | ||
| 2016 | 33 | 102.3% | 104.1% | 107.8% |
| Hover over boxplot or outliers for additional information |
| Chart generated 03/08/2018 |
| - Solids, ROE@180 Deg C (TDS), FIL, GRAV - |
| Lab: NWQL, PCode: 70300, MCode: ROE10 |
| Analysis Dates: 10/03/01 through 09/27/16 |
| Open Data Set |
| Boxplot Description |
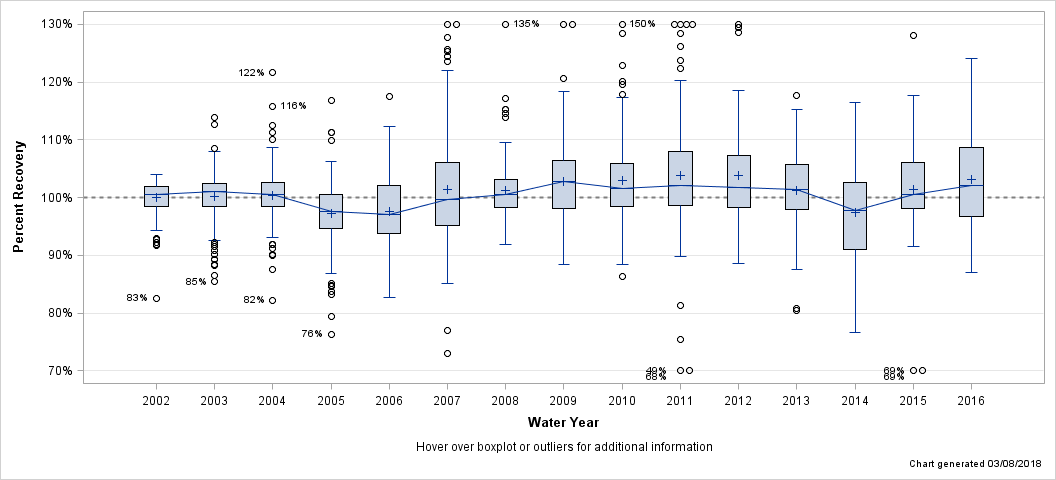
| Percent Recovery Statistics for Solids, ROE@180 Deg C (TDS), FIL, GRAV |
| Analyte | Parm-meth Code | Water Year | # of Samples |
25th Pctl | 50th Pctl (Median) |
75th Pctl |
|---|---|---|---|---|---|---|
| Solids, ROE@180 Deg C (TDS), FIL, GRAV | 70300ROE10 | 2002 | 238 | 98.5% | 100.6% | 101.9% |
| 2003 | 239 | 98.4% | 101.1% | 102.4% | ||
| 2004 | 144 | 98.4% | 100.5% | 102.6% | ||
| 2005 | 144 | 94.7% | 97.6% | 100.5% | ||
| 2006 | 138 | 93.7% | 97.1% | 102.0% | ||
| 2007 | 134 | 95.2% | 99.8% | 106.0% | ||
| 2008 | 143 | 98.2% | 100.5% | 103.1% | ||
| 2009 | 140 | 98.1% | 102.8% | 106.4% | ||
| 2010 | 137 | 98.4% | 101.5% | 106.0% | ||
| 2011 | 128 | 98.6% | 102.1% | 108.1% | ||
| 2012 | 96 | 98.3% | 101.8% | 107.3% | ||
| 2013 | 75 | 97.9% | 101.4% | 105.7% | ||
| 2014 | 65 | 91.1% | 97.7% | 102.6% | ||
| 2015 | 48 | 98.1% | 100.5% | 106.1% | ||
| 2016 | 44 | 96.8% | 102.1% | 108.7% |
| Hover over boxplot or outliers for additional information |
| Chart generated 03/08/2018 |
| - Specific Cond, LAB, UNF - |
| Lab: NWQL, PCode: 90095, MCode: WHT03 |
| Analysis Dates: 10/12/04 through 09/29/16 |
| Open Data Set |
| Boxplot Description |
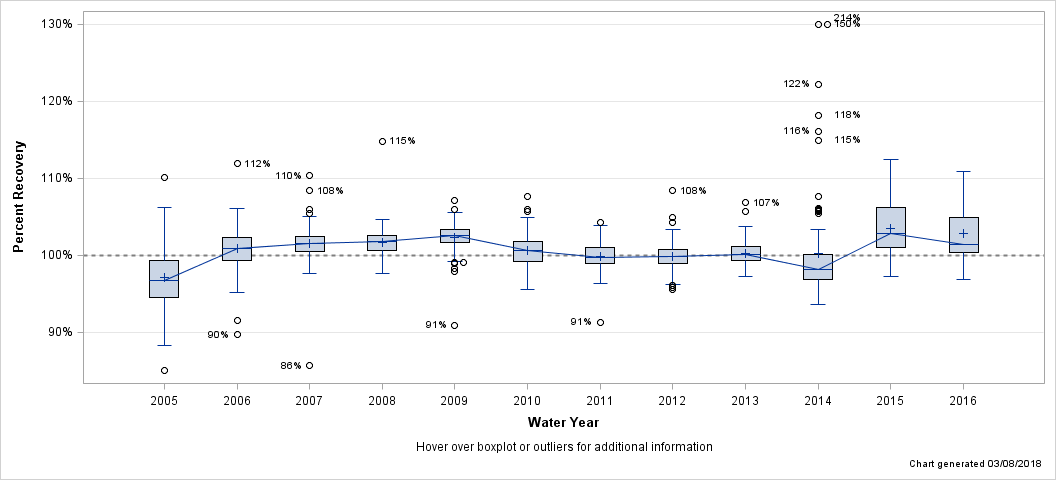
| Percent Recovery Statistics for Specific Cond, LAB, UNF |
| Analyte | Parm-meth Code | Water Year | # of Samples |
25th Pctl | 50th Pctl (Median) |
75th Pctl |
|---|---|---|---|---|---|---|
| Specific Cond, LAB, UNF | 90095WHT03 | 2005 | 140 | 94.5% | 96.7% | 99.3% |
| 2006 | 137 | 99.3% | 100.8% | 102.3% | ||
| 2007 | 132 | 100.5% | 101.5% | 102.4% | ||
| 2008 | 141 | 100.6% | 101.8% | 102.6% | ||
| 2009 | 141 | 101.6% | 102.5% | 103.3% | ||
| 2010 | 144 | 99.2% | 100.7% | 101.8% | ||
| 2011 | 138 | 98.9% | 99.7% | 101.0% | ||
| 2012 | 140 | 98.9% | 99.8% | 100.7% | ||
| 2013 | 124 | 99.3% | 100.1% | 101.1% | ||
| 2014 | 83 | 96.8% | 98.2% | 100.1% | ||
| 2015 | 71 | 101.0% | 102.8% | 106.2% | ||
| 2016 | 72 | 100.3% | 101.4% | 104.9% |
| Hover over boxplot or outliers for additional information |
| Chart generated 03/08/2018 |
| - Sulfate, FIL, IC - |
| Lab: NWQL, PCode: 00945, MCode: IC022 |
| Analysis Dates: 10/03/01 through 09/30/16 |
| Open Data Set |
| Boxplot Description |
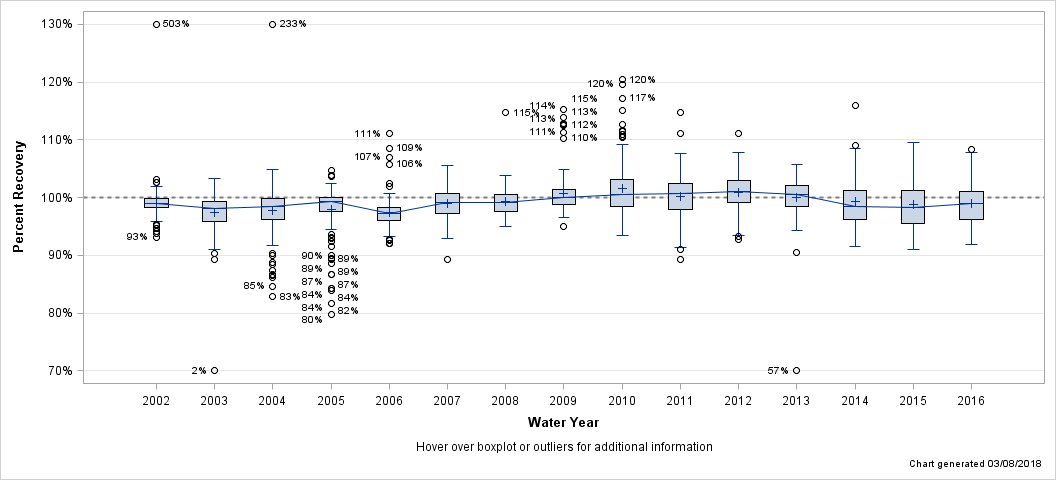
| Percent Recovery Statistics for Sulfate, FIL, IC |
| Analyte | Parm-meth Code | Water Year | # of Samples |
25th Pctl | 50th Pctl (Median) |
75th Pctl |
|---|---|---|---|---|---|---|
| Sulfate, FIL, IC | 00945IC022 | 2002 | 238 | 98.2% | 99.0% | 99.9% |
| 2003 | 239 | 95.9% | 98.1% | 99.3% | ||
| 2004 | 190 | 96.2% | 98.5% | 99.8% | ||
| 2005 | 144 | 97.6% | 99.2% | 99.9% | ||
| 2006 | 138 | 96.1% | 97.2% | 98.3% | ||
| 2007 | 134 | 97.2% | 99.2% | 100.8% | ||
| 2008 | 143 | 97.6% | 99.2% | 100.6% | ||
| 2009 | 140 | 98.9% | 100.0% | 101.4% | ||
| 2010 | 136 | 98.4% | 100.6% | 103.1% | ||
| 2011 | 138 | 98.0% | 100.7% | 102.5% | ||
| 2012 | 144 | 99.1% | 101.0% | 103.0% | ||
| 2013 | 124 | 98.4% | 100.5% | 102.2% | ||
| 2014 | 90 | 96.2% | 98.5% | 101.1% | ||
| 2015 | 72 | 95.4% | 98.3% | 101.2% | ||
| 2016 | 71 | 96.2% | 99.0% | 101.0% |
| Hover over boxplot or outliers for additional information |
| Chart generated 03/08/2018 |
| - Sulfate, FIL, IC, LL - |
| Lab: NWQL, PCode: 00945, MCode: IC024 |
| Analysis Dates: 10/10/01 through 11/01/13 |
| Open Data Set |
| Boxplot Description |
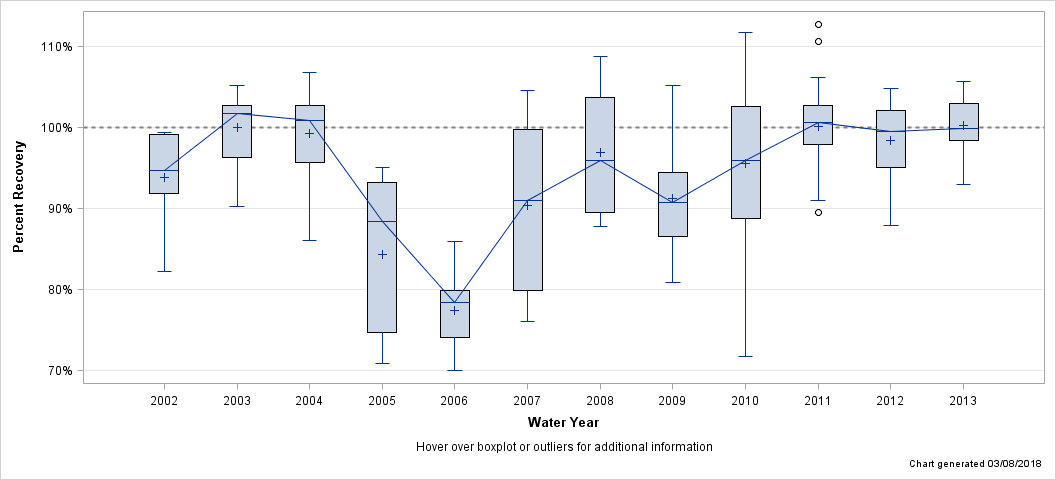
| Percent Recovery Statistics for Sulfate, FIL, IC, LL |
| Analyte | Parm-meth Code | Water Year | # of Samples |
25th Pctl | 50th Pctl (Median) |
75th Pctl |
|---|---|---|---|---|---|---|
| Sulfate, FIL, IC, LL | 00945IC024 | 2002 | 12 | 91.9% | 94.7% | 99.2% |
| 2003 | 22 | 96.3% | 101.7% | 102.7% | ||
| 2004 | 24 | 95.7% | 100.9% | 102.7% | ||
| 2005 | 48 | 74.7% | 88.4% | 93.3% | ||
| 2006 | 46 | 74.1% | 78.4% | 79.9% | ||
| 2007 | 46 | 79.9% | 91.0% | 99.7% | ||
| 2008 | 43 | 89.5% | 96.0% | 103.8% | ||
| 2009 | 40 | 86.6% | 90.7% | 94.5% | ||
| 2010 | 48 | 88.8% | 96.0% | 102.6% | ||
| 2011 | 47 | 97.9% | 100.6% | 102.7% | ||
| 2012 | 24 | 95.0% | 99.6% | 102.2% | ||
| 2013 | 24 | 98.5% | 99.9% | 102.9% |
| Hover over boxplot or outliers for additional information |
| Chart generated 03/08/2018 |